In 2004 I drafted a proposal called "The Intermodal Shell Game." It asked whether the efficiency of containerized shipping could be reconciled with security at the Ports of Los Angeles and Long Beach, and it imagined a terrorist's weapon of mass destruction, including a nuclear device, moving as the pea beneath the shells. The interviews, Delphi study, and agent-based model it promised were never carried out. This paper answers what can now be answered from public data. I find no public confirmation of a weapon delivered into a port by intermodal container since 2004, with one disputed case in which bombers reportedly hid in a container. That record sets a 95 percent upper bound of about 12 percent on the annual probability of such an event, too loose to exclude the rates at which more scanning would pay. The broader concern of 2004, that intentional violence is the gravest threat to ports, has held up in a different form. Conflict is the largest cause in the record, at 44 to 71 percent of impairment days depending on how open-ended events are counted, and it arrived by missile, drone, and blockade, not in a box. A rival explanation tested for this update, that accidents, strikes, cyberattacks, weather, and congestion were the main disruptors, was not supported. A small agent-based model finds a break in the trade-off between scanning and delay in most runs, and its location follows assumed inspection capacity. The requirement to scan every container remains in the U.S. Code and has never been implemented, and the Government Accountability Office reports that the layered alternative has not been fully assessed. In the studies available, the length of a closure and the availability of substitutes are large drivers of loss, though this record cannot test that. My judgment is that faster recovery deserves more attention than it receives. It would help where the port itself is damaged or stopped, and it would do little against a war at a chokepoint.
Preface
For centuries, at fairs and on street corners, the shell game has worked the same way. A hustler places a pea under one of three shells and shuffles them slowly enough to make the bet look safe. The mark watches the shells. The pea is usually somewhere else, palmed between the operator's fingers. The only way to win is to avoid playing.
In 2004 I proposed that a deadly version of the game was possible, with intermodal containers as the shells and a terrorist's weapon as the pea. Falsified bills of lading and the sheer number of boxes would keep up the illusion of normalcy. My question was whether the game could be avoided.
Twenty-two years later the question is still worth asking. Ports in those years were closed by intentional violence, as I feared, though by missile, drone, and blockade, and not by a weapon hidden in a box. The device I worried about has not been confirmed. That leaves the question open.
1. Scope
The 2004 document was a draft proposal to the National Science Foundation's Decision, Risk, and Management Science program, written at the University of Southern California during PLUS 692, Martin Krieger's conspectus seminar. It proposed interviews and a three-round Delphi study across five ports, a RePast agent-based model of container trade at Los Angeles and Long Beach, and a written report. A companion conspectus surveyed the analysis of rare events, infrastructure vulnerability, and the airport analogy. I find no evidence in my files that the fieldwork or modeling took place.
This paper does what public sources allow and leaves the rest undone. It uses the public record of port disruptions, federal incident data, the research that overtook the proposal, and the risk tools of PublicRisk.ai. I wrote the tests down and hashed them before running any of them (Appendix C). That plan is weaker for the event-record test than for the others: I had not seen the event table when I fixed the thresholds, but I knew of these events in general, and the hash is local and dated the same day as the work. Where a test failed, the paper says so. Model figures carry one of three labels: measured (reproducible from data, not proved), opinion (a judgment), or asserted (an input taken as given).
Three limits apply throughout. The Delphi study was never run, so there are no expert probabilities here, and I do not estimate the probability of an attack. The event record is a purposive list, not a census. And this paper is written for public discussion, so it reports aggregates only. It does not rank terminals, identify weak points, or discuss how screening might be defeated.
2. What changed
2.1 The trade grew, and the bay's share slipped
San Pedro Bay handled about 13.1 million TEU in 2004 and about 20.1 million in 2025: 10.24 million at Los Angeles and a record 9.88 million at Long Beach (Port of Los Angeles 2026; SupplyChainBrain 2026). The 2004 claim that the two ports carried more than 36 percent of U.S. containerized trade was right, at 36.4 percent of 2003 loaded TEU (MARAD 2004). The share has slipped on most comparable bases since, while absolute volume has risen by about half.
The world moved further. Hong Kong was the busiest container port on earth in 2004, and I counted the bay third at the time. By 2024 Shanghai handled 51.5 million TEU and Singapore 41.1 million, and Los Angeles and Long Beach ranked 16th and 19th separately (Lloyd's List 2025). Combined they would sit about ninth. Hong Kong's volume fell 41 percent from 2004, to 13.0 million TEU in 2025 (Hong Kong Marine Department 2026). The largest ship afloat in 2004 carried about 8,000 TEU, and today's carry about 24,000. Three alliances and MSC together hold roughly 83 percent of capacity (Container News 2025). The consolidation the proposal described has continued on a larger scale than it imagined.
2.2 The 100 percent mandate
The SAFE Port Act of 2006 and the Implementing Recommendations of the 9/11 Commission Act of 2007 wrote the shell game into law. Every U.S.-bound container was to be scanned at its foreign port of loading by July 1, 2012, with two-year extensions available (6 U.S.C. § 982). The provision is still in the Code.
It has never been carried out. In the Secure Freight Initiative pilots no port reached 100 percent: three small ports scanned between 54 and 86 percent, while Hong Kong and Busan reached 3 to 5 percent (GAO 2009). By 2012 only Port Qasim remained (GAO 2012). DHS issued blanket extensions in 2012, 2014, and 2016, carrying the deadline to July 2018, with Secretary Johnson calling compliance "highly improbable, hugely expensive" (GAO 2016). A second round of searches in October 2026 found no public extension after that date and no repeal, and GAO's 2025 cargo report does not mention the mandate. Such extensions were letters to Congress, so one may exist unpublished. The law stands, unmet, with its current legal footing unknown to me. The Congressional Budget Office put overseas scanning at $12 billion to $32 billion over ten years, and at $37 billion to $63 billion for one option if trading partners demanded reciprocity (CBO 2016).
What exists instead is a layered system of data review, targeting, and radiation monitoring, and the three are easily confused. All containers pass through automated targeting. About 99 percent of arriving seaborne containerized cargo is radiation-screened, by CBP's undated account. About 5 percent of inbound containers were imaged at U.S. seaports in the last seaport figure I can find, from 2016 (CBO 2016; CBP n.d.). CBP has since reported more than 17 million large-scale scans of sea containers, rail cars, and vehicles combined in fiscal 2025, but I find no split by mode, so the current seaport rate is unknown to me (Homeland Security Defense Forum 2026). My 2004 line about "pseudo-random samplings of less than two percent" was wrong twice: selection was by targeting, and the rate had already reached 5.4 percent by fiscal 2003 (GAO 2004; Fox News 2004).
In January 2025 GAO found that DHS had not fully assessed the effectiveness of the layered approach, with two recommendations to the Coast Guard still open and an estimated completion date of the end of December 2026 (GAO 2025). The fiscal 2026 act, Public Law 119-86, carries no appropriation for the Countering Weapons of Mass Destruction Office, successor to the Domestic Nuclear Detection Office. Section 513 lets the Secretary reallocate the office's functions, consistent with a table in the explanatory statement, and I find no repeal of its authorizing statute in the act. The January 2026 statement sends risk and detection architecture to the Office of Strategy, Policy, and Plans, radiation portal support and procurement to CBP, and training, Securing the Cities, and biological programs to FEMA, with detection equipment to several components and research to Science and Technology. It directs the Secretary to name a department-wide coordinator and to brief Congress within 90 days on avoiding any degradation of the functions (U.S. House 2026). Press reports describe the office as dissolved (Federal News Network 2026). I have not confirmed that the January statement is identical to the one that accompanied the enacted act.
2.3 Security went digital
The 2004 conspectus treated containers as physical boxes and terminals as perimeters. Since then the terminal has become a computer. NotPetya cost Maersk $250 million to $300 million in 2017 (The Register 2017), ransomware halted Nagoya in 2023, and an intrusion stopped DP World's Australian terminals that November. Executive Order 14116 and a Coast Guard rule effective July 16, 2025 now require cybersecurity plans at regulated facilities, with first plans due July 2027 (USCG 2025). Congress has separately examined Chinese-made ship-to-shore cranes, and the Coast Guard has testified that no malware was found (gCaptain 2024). The proposal had no agent for any of this.
The Terrorism Risk Insurance Act, which the 2004 conspectus doubted, expires December 31, 2027. The House and Senate each passed seven-year extensions in 2026, but the bills differ. The latest report I can find, dated October 1, 2026, has the differences unresolved, and I find no enactment as of this writing (Insurance Journal 2026; Carlton Fields 2026).
2.4 The research overtook the proposal
Soon after my draft, others answered much of the question. Martonosi, Ortiz, and Willis (2005) found 100 percent inspection cost-effective only if damage or likelihood is quite high. Meade and Molander (2006) examined a 10-kiloton device in a container at Long Beach, with up to 60,000 deaths and early costs over $1 trillion, and stated that its probability could not be calculated. Rosoff and von Winterfeldt (2007) analyzed dirty bomb attacks on these two ports. They put health effects at tens to hundreds of latent cancers. Modeled shutdowns of 15 days, 120 days, and one year cost about $300 million, $63 billion, and $252 billion, and the 15-day case is small because ships wait and cargo moves through other ports. Bakshi, Flynn, and Gans (2011) simulated how quickly inspection saturates a working terminal: at 5 percent of volume, 16.2 percent of tagged boxes missed their vessel, and at 7 percent, more than 99 percent did.
Von Winterfeldt was the principal investigator named on my 2004 draft. Their paper is the study that draft might have become, and it is better than what I proposed. I did not find an agent-based model of the efficiency-security trade-off at San Pedro Bay, though one search does not settle that.
3. The record, 2004 to 2026
3.1 What the record contains
Appendix A lists 24 events from January 2004 through October 30, 2026 in which a container port or chokepoint was closed or seriously impaired for at least a day and a duration can be supported. Six other cases were examined and excluded, chiefly because no defensible duration exists. They include Tianjin in 2015 and Beirut in 2020, two of the deadliest port disasters of the period, so this table measures time impaired and misses much of what was lost. Figure 1 tabulates the days.
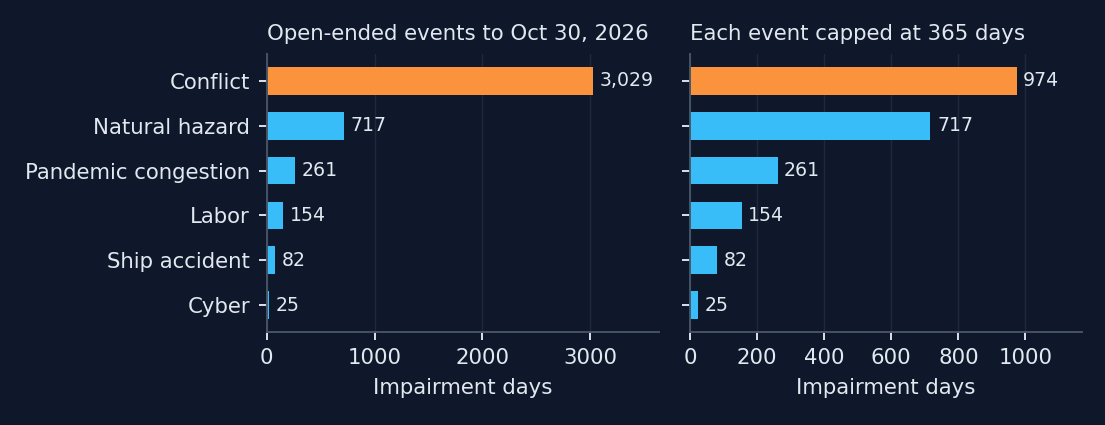
The 2004 proposal was about terrorism: a weapon of mass destruction moved by container. It made no claim that ordinary disruptions would outweigh violence. The study plan for this update tested that opposite idea as a rival explanation, in two parts: that no weapon would have arrived by container, and that causes other than a container weapon or other intentional physical attack would hold at least 75 percent of impairment days. Non-conflict causes hold 29.0 percent of days, below the 50 percent floor set in the plan, so the preregistered verdict is NOT SUPPORTED. With each event capped at a year the share is 56.0 percent, which is PARTIAL. The failure of that rival explanation counts in favor of the proposal's general concern, though it does not show that the proposal's specific event was likely.
These numbers depend on how the clocks stop, and the rule is uneven. Non-conflict events stop at first or limited resumption, while conflict clocks run through partial operation. I therefore treat the three open-ended durations as asserted. Ending the Black Sea clock when the grain corridor opened raises the non-conflict share to 45.8 percent. Also ending the Red Sea clock at the last severity evidence I have, May 2025, raises it to 56.6 percent, which is PARTIAL. Removing the two other asserted durations from the capped count lowers it to 41.6 percent. The verdict is NOT SUPPORTED as long as conflict days exceed 1,239. Conflict is the largest single class under every one of these rules.
The three conflicts differ in kind. The Black Sea blockade began in February 2022. The Houthi campaign from November 2023 left Suez tonnage about 70 percent below 2023 levels as of May 2025 (UNCTAD 2025), and it diverted ships more than it closed ports. After the Hormuz closure of February 28, 2026, average daily transits fell from 129 to 6 in March (UNCTAD 2026). Jebel Ali handled 374,000 TEU in the second quarter of 2026 against 3.8 million a year earlier, down 90.1 percent, the largest throughput loss at a single major port in this list (Seatrade Maritime 2026). DP World reports no physical damage to the port. The International Maritime Organization counted at least 20 seafarers or port workers killed in 68 incidents through late August (Ahram Online 2026), and on October 14 the Singapore-flagged container ship GFS Pride sank in the strait after being struck, with all 21 crew evacuated (CNBC 2026). The closure has not been uniform. Crude exports through the strait returned to prewar levels in September before falling again by nearly 40 percent in mid-October (CNBC 2026). Trackers counted anywhere from 2 to 13 crossings a day in late October, and they count different things (Windward 2026; straits.live 2026). The 244 days in Appendix A therefore describe container trade better than oil. The conflict continues, and these figures come from press and trade reports.
3.2 The container-weapon class
I find no public confirmation that a terrorist weapon or WMD has been delivered into a port by intermodal container. I also find no authority stating that negative in so many words, so this is absence of evidence. DHS has called the likelihood low (GAO 2012), while GAO still treats the risk as live (GAO 2025).
One case tests this. At Ashdod in March 2004, two suicide bombers killed 10 people at the port and reportedly entered from Gaza hidden in a container (Israel MFA 2004). The account comes from an Israeli government source, and a Fatah leader claimed the attackers used tunnels. It is not in my 2004 proposal, though it happened the month before the proposal's date. I treat it as unconfirmed because the route is disputed and it concerned people rather than a weapon. If it counts, the first part of that test fails too, and it would be the closest thing on record to the event I proposed, on a far smaller scale.
Other near cases are different in kind. In 2009 the UAE seized a ship carrying ten containers of North Korean arms declared as oil equipment (NBC News 2009), which shows that states have attempted concealment in containers. Tianjin involved dangerous goods stored at a port, and at Bandar Abbas in 2025 containerized chemical shipments were reported, although Iran disputes that account and the cause is unsettled.
3.3 What zero means
Zero events in 22.8 years gives an exact one-sided 95 percent upper bound of 0.131 a year on a Poisson rate, or a 12.3 percent annual probability of at least one event (measured). If Ashdod counts as one event, the bound on the rate is 0.208.
This is the most the data can exclude, and it estimates nothing. It covers publicly confirmed deliveries, so foiled or undisclosed attempts are invisible to it. Nor can non-occurrence be divided into deterrence and non-attempt. With the layered system unassessed, we cannot say that security worked and we cannot say it was unneeded.
3.4 Heavy tails
The conspectus asserted that terrorism severities are fat-tailed, and my May 2004 seminar notes proposed Poisson or negative binomial counts with truncated Pareto severities. Attacks on ports cannot test this, and nothing here does. Ordinary hazardous materials transport can test whether such severities are common in this domain. I fit PHMSA's incident reports from January 2005 through July 2025: 395,712 reports, of which 85.7 percent carry zero damage, in 2024 dollars (Figure 2).
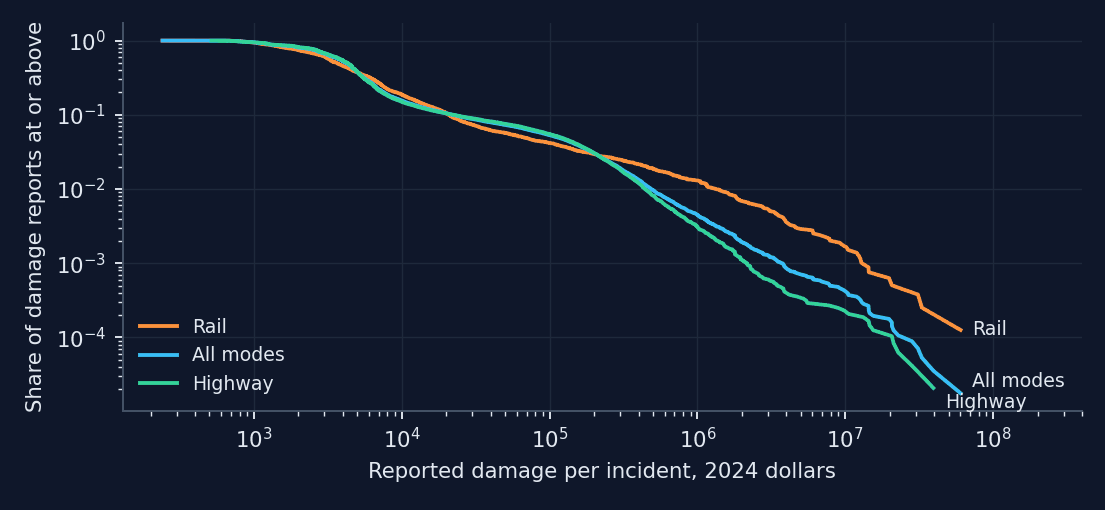
The tail is much heavier than exponential (Vuong test p < 0.001), and the top 1 percent of damage reports carry 57 percent of reported dollars. Across all modes the estimated density exponent is 2.13 above about $525,000, on 508 reports. The bootstrap 95 percent interval, with the threshold re-chosen in each replicate, is 2.04 to 2.26. Highway alone is 2.38 (2.33 to 2.59), rail 1.55 (1.53 to 2.00), and air 1.84 (1.60 to 2.04) on only 246 reports with damage. The exponent drifts with the threshold, from about 2.0 to 2.15 between the 95th and 99.5th percentiles of damage.
My plan set a bar of an exponent below 2 and called that infinite variance. That was a mistake. With this exponent, the mean is infinite below 2 and the variance below 3. Read literally, the all-modes fit misses the bar. Read as intended, a Pareto of 2.13 has finite mean and infinite variance. But a lognormal, whose moments are all finite, fits about equally well (p = 0.71), and for highway and air the lognormal fit collapses into the Pareto, so the data show no curvature to separate them. Rail prefers the lognormal (p = 0.02). About a third of damage reports above $1,000 sit on round thousands, but dithering them leaves the rail exponent near 1.55, so rounding does not drive that result. The verdict is PARTIAL, my label for a gap in the plan's rules: severity is clearly heavy-tailed, and whether any moment is infinite is unresolved.
Counts were overdispersed. All incidents vary 774 times more than Poisson allows, driven by trends in reporting. Incidents of at least $1 million in 2024 dollars average 12.6 a year with dispersion of 1.8, and a negative binomial is preferred over a Poisson (p = 0.03). Water could not be tested, with 824 reports and 99 recording damage.
4. The trade-off, modeled at last
The proposal promised a model of "critical breakpoints." I built a small one (Appendix B). Shippers with differing tolerance for delay and differing costs of switching choose each week between San Pedro Bay and an alternate gateway. Traffic passes through one pooled set of gates, scanners, and secondary exams, with capacity that varies from day to day, and queues feed back into shippers' choices. I dropped RePast for a single file of Python. The proposal's "will to infect" and "will to inoculate" are gone: without Delphi data those quantities would be invented. Annual import volume is sourced, and every other parameter is asserted. The model is a test of shape and cannot predict San Pedro Bay.
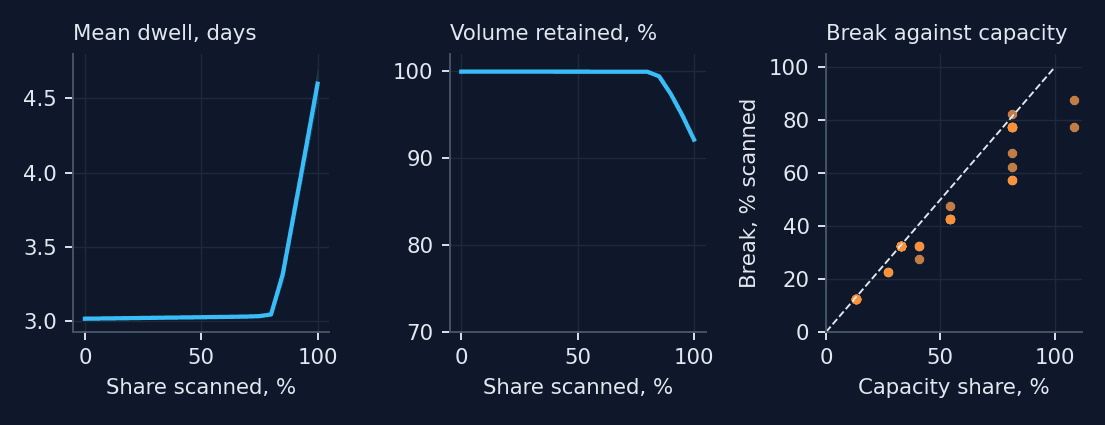
In the base case dwell stays near 3.0 days until about 80 percent of containers are scanned, then climbs to 4.6 days at 100 percent, while retained volume falls from nearly 100 to 92 percent. The break in marginal delay falls at 77.5 percent, in the same place across seeds.
The sensitivity runs show what that number is worth. Marginal delay rose at least five-fold in 50 of the 60 parameter sets, and 10 showed no break. Where a break appeared it ranged from 12.5 to 87.5 percent, and only 10 of 60 sets fell within 10 points of the base case, against the 80 percent the plan required. The break correlates at 0.97 with a simple ratio: the share of containers that scan and exam capacity can handle at the assumed demand. Under the preregistered rule the verdict is CONDITIONAL. The break is a queueing result, and its location is set by capacity I assumed. At 100 percent scanning median dwell across the sets was 8.9 days and median retained volume 52 percent. The largest dwell, 95 days, reflects a queue still growing at the end of the 730-day run.
So the breakpoint is an empirical question about scanner and exam capacity. Bakshi, Flynn, and Gans's simulation, built on a working terminal, says saturation can arrive near 7 percent there. No public data I could obtain settles it for San Pedro Bay.
5. What drives port losses
My first draft claimed that loss depends on duration and not on cause. Review showed that the claim was partly circular, and I set out here what can be said instead.
Table 1. Port loss estimates by what they measure. Figures are not commensurable.
| Event or scenario | Physical damage | Closure or economic effect | Source |
|---|---|---|---|
| SAFRR tsunami, Mw 9.1 (modeled) | About $110M at LA and Long Beach | About $2.2B GDP; resilience could cut this 80 to 85% | Porter et al. 2013; Rose et al. 2016 |
| Local tsunami closing the ports up to a year (modeled) | Not separated | $7B to $40B | Borrero et al. 2005, in Wein et al. 2013 |
| ShakeOut M7.8, regional (modeled) | $113B property | $68B business interruption | Rose, Wei, and Wein 2011 |
| Dirty bomb, LA and Long Beach (modeled) | Decontamination up to about $100B | About $300M, $63B, $252B for 15 days, 120 days, 1 year | Rosoff and von Winterfeldt 2007 |
| 90-day Texas port disruption (modeled) | Not applicable | Up to $13B gross output; resilience cuts nearly 70% | Rose and Wei 2013 |
| 2002 West Coast lockout (observed) | None | $1.94B a day projected; $6.28B stranded goods estimated; both contested | Hall 2004 |
| 2014 to 2015 West Coast slowdown (observed) | None | About 0.2 points off Q1 2015 GDP growth from exports | Amiti et al. 2015 |
| Beirut, 2020 (observed) | $3.8B to $4.6B | $2.9B to $3.5B economic loss | World Bank 2020 |
| Dali, Baltimore, 2024 (observed) | Key Bridge lost; 6 deaths | 76 days to full channel; no total found | Seatrade Maritime 2024 |
Three things can be said. In the port studies that vary it, closure length matters a great deal, but those studies set it as an input, so this is an assumption explored and not a discovery. Rosoff and von Winterfeldt's costs rise much faster than duration between 15 and 120 days, which suggests that substitution absorbs short closures and fails in long ones. Second, substitution looks at least as important as length. The West Coast slowdown ran for months at a cost of a few tenths of a point of quarterly growth, because cargo moved through other ports and imports rebounded in March (Amiti et al. 2015). Hall (2004) argued that the lockout estimates ignored substitution. Third, physical damage is not always the small part. It exceeds economic loss at Beirut and in ShakeOut.
Cause and duration cannot be separated in this record. Cyber events ran days, labor days to months, conflict months to years. Cause predicts duration, the event record has no loss variable, and no test here holds one fixed while varying the other.
5.1 Platform cross-checks
PublicRisk.ai's tools were built for other problems, and only part of them applies here. A National Structure Inventory scan within about 4 km of the harbor district returned 14,946 structures valued at $31.3 billion, with about 104,000 people present by day (measured, aggregate only). At a USGS-derived 475-year ground motion of 0.455 g, the platform's Hazus 6.1 fragilities give expected damage ratios from 0.07 for modern wood frame to 0.77 for pre-code concrete, the structural class extremes. Applied to the whole inventory, that is about $2.3 billion to $24 billion in building damage, a bracket and not an estimate. It ignores liquefaction and covers buildings only. Hazus treats waterfront structures separately, and I claim no wharf or crane loss (Özcebe, Bozzoni, and Borzi 2022).
The cyber tool failed its check. It prices a single breach at a large public entity at no more than $12 million, at least 20 times below Maersk's loss, because it measures data-breach cost and leaves out business interruption. I report that as a limit and have not used it.
The platform's general chemical module assumes a neutral plume, so I used its separate dense-gas module, which reads EPA's offsite consequence tables and applies the Britter-McQuaid correlations. For a generic accidental loss of one 20-tonne tank container over 10 minutes, EPA's worst-case tables give 6.2 miles (urban) to 13 miles (rural) for chlorine and 2.3 to 3.6 miles for anhydrous ammonia, to EPA's planning endpoints. Britter-McQuaid gives 11 to 17 km for chlorine at winds of 2 to 5 m/s, and it does not apply to ammonia as run, because the release was entered at ambient temperature (measured, on an asserted scenario). These are conservative regulatory distances to protective endpoints, not lethal ranges, and no location or population enters them. They show that the hazard in an ordinary box can reach well past a terminal fence. I give no casualty figure. Fixed facilities add to that picture: of 11,769 current EPA Risk Management Plan facilities nationally, 7 lie within about 4 km of the harbor district and 22 within about 10 km (measured, a count of box areas, with no facility, chemical, or scenario data drawn).
The fiscal simulator, run on the Port of Los Angeles's adopted budget (operating receipts of $657.6 million, $1.5 billion in unrestricted cash; Port of Los Angeles 2025), shows another side of Section 5. With an asserted mix of short closures and a 1 percent annual chance of a long one, lost operating revenue averages about $7.5 million a year, with no simulated year in deficit (measured, with no insurance or outside aid entered and debt service left out). A closure costs the port about $1.8 million a day in receipts, so even a full year's receipts sit well inside its cash. The regional losses in Table 1 are far larger and fall mainly on shippers, workers, and consumers. The party that controls a port's security and recovery spending may bear a small part of what a closure costs. That is my inference, and it covers one port and revenue only.
The lifeline cascade model ran, but it has no port node. Impairing transportation by an asserted 80 percent gives 80 percent in all nine lifelines at the high bound and no spread at the low bound, because most links have no sourced lower weight. A bracket that wide says nothing, and I draw nothing from it. The policy-regime simulator and wicked-problem tools produce noise-driven or placeholder output, and nothing from them is used.
6. The decision
The proposal asked whether the current state of security was "a rational response, once the probability of an occurrence and the expected effect on consumer prices are taken into account." Since the probability cannot be known, the useful form of the question is the reverse: how likely would an event have to be for each option to pay?
I solved this with the platform's influence-diagram solver, comparing the status quo, expanded targeting (imaging rising from about 5 to about 10 percent), and 100 percent scanning. The probability is that of an attack that would succeed under present layers, since the status quo carries the full loss. Expanded targeting costs about $65 million a year, from 600,000 more inspections at Bakshi, Flynn, and Gans's $108.71 per box. Full scanning costs $1.2 billion to $3.2 billion a year from CBO, plus about $470 million a year in delay taken from the agent model at an asserted $25 a box-day. Consequence is taken at three published values: $29 billion (Park 2008, as cited by USGS), $100 billion (the upper shutdown figure in Rosoff and von Winterfeldt's summary table), and $1 trillion (Meade and Molander's round estimate). The gain in interception is unknown and asserted at three levels, up to 15 percent for expansion and up to 60 percent for full scanning, at a fixed ratio of one to four. Dollar years are mixed.
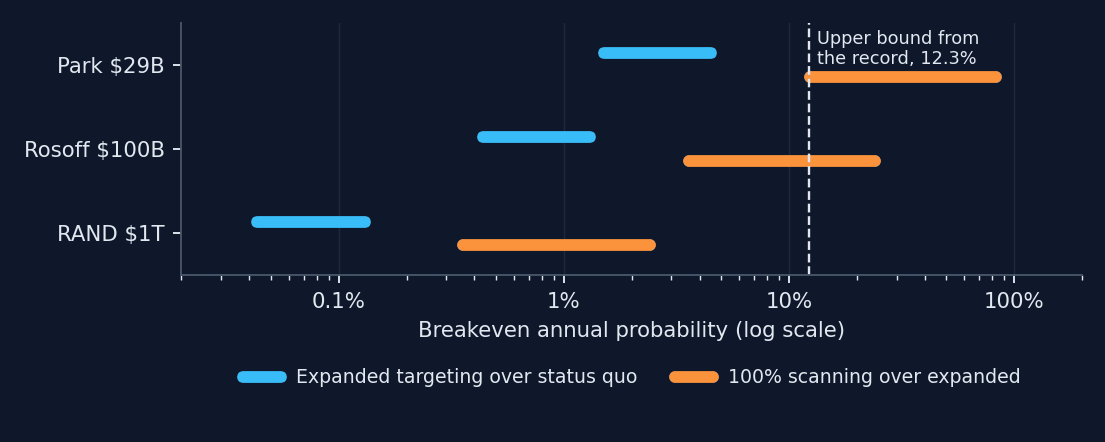
Expanded targeting pays above probabilities of 0.04 to 4.5 percent. That excludes its delay, which Bakshi, Flynn, and Gans suggest may not be negligible, given that 10 percent is above the 7 percent at which their simulated terminal saturated. Their result concerns an origin terminal and the 5 percent figure concerns U.S. imaging, so the two do not map exactly. Full scanning pays above 0.36 to 83 percent with delay, or 0.25 to 72 percent without it. At a 1 percent annual probability the solver keeps the status quo in 8 of the 18 cells, including all six at $29 billion. Eleven of the 18 full-scanning thresholds fall below the 12.3 percent bound. That is a tally over an asserted grid and carries no probabilistic weight, but its direction is clear: the record cannot rule out rates at which these steps pay.
Consequence and the invented gains both matter. Within the $29 billion row alone, gain and cost move the full-scanning threshold about seven-fold, and consequence moves it about thirty-fold. Several simplifications all push these breakevens down. Each event carries the scenario's full consequence, national program costs are set against one region's loss, and a determined adversary may move to a route that is not scanned. Contraband caught along the way would push them back up.
I also calculated the value of knowing how well the layers work, the question GAO left open, by making effectiveness an uncertain state. At the middle cost and a 1 percent probability it is worth nothing at $29 billion, about $5 million a year at $100 billion, and about $210 million at $1 trillion (measured, given asserted inputs). It is small because the choice rarely depends on it. Effectiveness data would matter chiefly near a decision boundary or for judging existing spending, which this calculation does not cover.
6.1 Recovery on the same terms
Fairness requires applying the same arithmetic to recovery, using the simple breakeven of annual cost divided by the loss avoided. A program at the scale of the Port Security Grant Program, $90 million a year, avoiding an asserted 25 to 50 percent of the loss, pays above annual probabilities of 0.18 to 0.36 percent at $100 billion and 8 to 16 percent at the SAFRR tsunami's $2.2 billion. At $300 million a year the same thresholds are 0.6 to 1.2 percent and 27 to 55 percent. These hurdles are of the same size as scanning's. Recovery has one advantage: several causes can trigger it, so the relevant probability is the sum across them, though most events in the record are small and short. It has two limits. Modeled resilience of 70 to 85 percent comes largely from substitution and adaptation that happen anyway, and it says nothing about what money buys. And recovery does little for the deaths and destruction that dominate the $1 trillion scenario.
The two options interact. If resilience cuts loss by 70 to 85 percent, every scanning breakeven rises by 3.3 to 6.7 times.
7. What held up
Table 2. The 2004 claims, scored.
| 2004 claim | Verdict in 2026 |
|---|---|
| A container could carry a weapon into a U.S. port | Not disproved. No confirmed case; one disputed case; the record cannot exclude it |
| Efficiency trades against security | Holds; in simulation saturation came far sooner at a working terminal than I assumed |
| Global shipping had consolidated into mega-ports | Accurate, and it continued |
| Agent-based modeling would reveal critical breakpoints | Partly. The break in my model is a capacity ratio, and the capacity is assumed |
| Terrorism severity is fat-tailed | Untested for terrorism. Hazmat severity is heavy-tailed; whether moments are infinite is unresolved |
| Frequency could be modeled as Poisson or negative binomial | For hazmat, negative binomial preferred |
| The rate of container "infection" can be derived from crime and piracy rates | Not supported by anything I found. I would not repeat it |
| Ports are harder to fence than airports; layered security is needed | Layers became the policy; their effectiveness remains unassessed |
| "Less than two percent" inspected | Out of date by 2004; selection was by targeting |
| "An indictment of containerization as too risky" might follow | Not shown. Volume grew by half at the bay, but volume does not measure risk |
| Intentional violence is the gravest threat to ports | Held in general. Conflict is the largest class in the record, but it came from states and militias by missile, drone, and blockade, a route the proposal did not consider |
| A WMD delivered by container is the specific form that threat would take | Not confirmed. No such event is on record, and the record cannot exclude one |
Several 2004 facts need correcting. The figure of 17,000 containers a day implies 6.2 million a year, which conflicted with the conspectus's 8 million; GAO's count for 2002 was about 7 million, and the latest official sea-only count is about 12 million for 2016 (GAO 2004; CBO 2016). The 361 "Atlantic and Pacific seaports" was a count of public seaports, rivers included, while 74 U.S. ports received international containers in 2016 (CBO 2016). "Over eighty percent of imports" by container is unsupported by value or weight. The $16 billion piracy figure was a circulated estimate of piracy and maritime fraud together, and I cannot trace it to the International Maritime Bureau as I claimed. The $2.7 billion in cargo theft at the bay assumed that theft scales with port share. The Complexity of Cooperation is 1997, and Durkheim's Rules is 1895 with a 1901 preface. The 416 U.S.-flag ships were real but included 179 government-owned vessels: the like-for-like comparison is 237 private ships in 2003 against about 187 in 2025, on a preliminary reading of MARAD's table (MARAD 2025). The 2004 epigraph misquoted Bukowski. Two typescripts of the poem, signed January 25 and 26, 1982, survive in images on bukowski.net, and neither has my "and." This version uses the later one. I have not located a published text, which may differ.
8. Conclusions
The shell game's lesson was that the only way to win is to avoid playing. A trading nation has no such option, so the practical question is how to spread the bet. The first three points below rest on the analysis, and the last three are my opinion.
The record cannot settle the scanning question. Twenty-two years without a confirmed container weapon do not show the risk is small, and the breakevens are spread too widely, on inputs too uncertain, to choose among policies by calculation. Expanded targeting has a low breakeven if its delay is negligible, which is itself in doubt. Full scanning requires believing in a very large consequence or a large gain in interception.
The capacity data that would decide the delay question are not public. The model's main result is that the break follows inspection capacity. The interviews the proposal promised would still be worth doing for that reason.
Conflict belongs in any port risk analysis. San Pedro Bay's own events in this record are labor disputes, congestion, and cyber incidents, and no conflict has closed it. The effect would arrive through shipping schedules, war-risk pricing, and rerouted fleets, and neither scanning nor perimeter security is any help.
Settle the 100 percent mandate. A requirement unmet after 14 years, with no extension I could find, should be funded, amended, or repealed. Whether a trillion-dollar tail justifies it is a judgment elected officials should make in the open.
Account for the counter-WMD mission. Whatever the merits of the 2026 reorganization, the public should be able to see where those functions now sit.
Give recovery comparable attention. Pre-arranged reopening authorities, clearance standards agreed before an event, rerouting agreements among gateways, and cyber recovery that can run a terminal on paper should help where the port itself is damaged or stopped. Rosoff and von Winterfeldt noted that closure length would depend in part on the decision to declare the ports safe, and that decision can be prepared in advance. I have no evidence on what such measures cost or how much they shorten closures. Events of that kind, natural hazards other than drought, accidents, and cyber incidents, are only about 11 to 21 percent of impairment days in this record, and much of that is one tsunami. For a war at a chokepoint, reopening capability does nothing, and only rerouting and contract terms apply.
Much of what the proposal promised remains undone. This paper should be read as a partial accounting of an old bet.
9. Limits and departures
The event list began from a seeded list of known cases and will have missed others. Coverage of Black Sea, Sudanese, and Yemeni port strikes is thin, and some Black Sea sources are partisan. Durations are often approximate, and many event facts rest on trade press and on search extracts of government pages that blocked direct retrieval. The status of the 100 percent mandate after 2018 and the seaport imaging rate after 2016 remain unconfirmed after a second search and would need a Congressional Research Service inquiry or a records request. Damage reports include zeros that may be unrecorded damage. The Vuong tests against the exponential are approximate for tails this heavy, though the likelihood gap is large.
I departed from the written plan as follows.
T1. The plan calls this the thesis test. That was a poor label: the hypothesis was written for this update and was never a claim of the 2004 proposal, and an earlier draft of this paper wrongly described it as my working thesis. The test and its thresholds are unchanged.
T3. The plan's exponent bar misdescribed what an exponent of 2 means; I kept the literal test and report the corrected meaning, and PARTIAL is my label. The threshold scan and bootstrap were first run in a restricted form and were rerun after review as reported here, with damages deflated by CPI-U.
T4. An abstract adversary with a detection sweep was planned and dropped, since detection plays no part in delay. Terminals were pooled, with no yard capacity. The first version showed volume loss before visible delay. Review traced that to shippers with a zero premium in a truncated distribution, and the planned low-decile ratio was undefined because that version had no per-box delay. I rebuilt the premium as strictly positive, added exam time and capacity noise, swept dispersion and inertia, and reran at the planned 30 seeds. The rebuild came after seeing results. The verdict did not change.
T5. The planned delay cost was added after review for full scanning only. The recovery calculation in Section 6.1 and the effectiveness calculation were added after the plan. EVPI on the attack state was dropped: it mainly recovers the assumed program cost.
T6. ShakeOut was used from the literature, with no platform run. In an earlier draft I skipped the chemical, fiscal, and cascade tools, and wrongly said the platform could not model dense gas. On a relook I ran all three and added an aggregate count of Risk Management Plan facilities, as reported in Section 5.1. Those runs came after the plan and after the main results.
Acknowledgments
The 2004 proposal was prepared at the University of Southern California in Martin Krieger's PLUS 692 seminar, and the draft listed Detlof von Winterfeldt as principal investigator. This version is the author's alone.
Appendix A. Event record
Days are the impairment days used in Figure 1. Event-by-event sources are available from the author.
Table A1. Events included, 2004 to October 30, 2026.
| Event | Class | Days | Basis |
|---|---|---|---|
| Katrina, New Orleans, 2005 | Natural | 14 | To limited cargo |
| Tohoku, Sendai, 2011 | Natural | 317 | To international terminal resumption |
| Sandy, New York and New Jersey, 2012 | Natural | 8 | To last terminal |
| Clerical strike, LA and Long Beach, 2012 | Labor | 8 | Strike |
| West Coast slowdown, 2014 to 2015 | Labor | 120 | About 4 months |
| NotPetya, Maersk, 2017 | Cyber | 9.5 | Midpoint of 7 to 12 |
| Harvey, Houston, 2017 | Natural | 7 | To container resumption |
| Ever Given, Suez, 2021 | Accident | 6 | Canal blocked |
| Yantian, 2021 | Pandemic | 21 | About 3 weeks |
| Transnet, South Africa, 2021 | Cyber | 10 | To force majeure lifted |
| San Pedro Bay congestion, 2021 to 2022 | Pandemic | 180 | Asserted: "months," no firm dates |
| Shanghai, 2022 | Pandemic | 60 | About 2 months |
| Ian, Florida, 2022 | Natural | 4 | Pre-emptive closure |
| British Columbia strike, 2023 | Labor | 13 | Strike |
| Nagoya, 2023 | Cyber | 2.5 | Outage |
| Panama drought, 2023 to 2024 | Natural | 365 | Asserted: about a year of reduced transits |
| DP World Australia, 2023 | Cyber | 3 | Outage |
| Dali, Baltimore, 2024 | Accident | 76 | To full channel |
| ILA strike, 2024 | Labor | 3 | Strike |
| Canadian ports, 2024 | Labor | 10 | Stoppage |
| Melissa, Kingston, 2025 | Natural | 2 | To resumption |
| Black Sea, 2022 to date | Conflict | 1,709 | Asserted: open-ended |
| Red Sea, 2023 to date | Conflict | 1,076 | Asserted: open-ended |
| Hormuz, 2026 to date | Conflict | 244 | Asserted: open-ended |
Excluded: Tianjin 2015 and Beirut 2020 (recovery length unconfirmed), Bandar Abbas 2025 (partial, cause disputed), COSCO 2018 (terminals kept working), Rhine 2018 and 2022 (inland), Port-au-Prince 2010 (unsourced).
Appendix B. Model specification and test summary
Daily step, 730 days, first 180 discarded, 30 seeds per point. 5.6 million import boxes a year, from 10.06 million import TEU in 2025 (Supply Chain 24/7 2026) at an asserted 1.8 TEU per box. Thirteen terminals' worth of pooled capacity, four scan lanes each, 16 lane-hours a day, 2 minutes a scan, 2 percent referral to secondary, 1 added day for a referred box, 250 exams a day, daily capacity noise of 10 percent, gate capacity 1.25 times mean demand, 3-day base dwell, lognormal value of time with a $25 a box-day median, lognormal alternate-gateway premium with a $250 median, 85 percent weekly inertia. All are asserted except volume. Sensitivity drew 60 sets, with replacement, over scan time, lanes, gate slack, referral, exam capacity, premium level and dispersion, inertia, and value of time.
Table B1. Tests and verdicts.
| Test | Question | Result | Verdict |
|---|---|---|---|
| T1 | Did causes other than a weapon or conflict dominate? | No confirmed weapon events; 29.0% of days (56.0% capped) | NOT SUPPORTED (PARTIAL capped) |
| T2 | What does zero exclude? | 12.3% annual probability, upper bound | Too loose to settle T5 |
| T3 | Is severity heavy-tailed? | Exponent 2.13 all modes; lognormal not excluded | PARTIAL |
| T4 | Is there a critical breakpoint? | Break in 50 of 60; 12.5 to 87.5%; 10 of 60 near base | CONDITIONAL |
| T5 | At what probability does scanning pay? | 0.04 to 4.5%; 0.36 to 83% | No verdict rule set |
| T6 | How do natural hazards compare? | Mixed; see Table 1 | Descriptive |
Appendix C. Reproducibility
The study plan was written before any test was run, SHA-256 2E71795D373F578850A641C58E1B9B1E9D4DBC3B47F6BA06E0A8BD445F2823D4, recorded October 30, 2026 at 18:54 Pacific. It is hashed locally and not lodged with a third party. The event table was compiled in parallel and reached me after the plan was fixed. PublicRisk.ai code ran from the current main branch at commit 95b78c3a2. The plan, scripts, result files, and research record are available from the author. Time-sensitive facts were rechecked on October 30, 2026. PHMSA data come from the Data Liberation Project's monthly files, and CPI-U from FRED series CPIAUCNS. No security-sensitive information, facility-level worst-case data, or proprietary rail data was used.
References
Ahram Online. 2026. "Six Months of War: 20 Dead in 68 Incidents near Hormuz: IMO." https://english.ahram.org.eg/News/575194.aspx
Amiti, M., T. Bodine-Smith, M. Cavallo, and L. Lewis. 2015. "Did the West Coast Port Dispute Contribute to the First-Quarter GDP Slowdown?" IFDP Notes, Federal Reserve Board, July 2.
Axelrod, R. 1997. The Complexity of Cooperation. Princeton University Press.
Bakshi, N., S. E. Flynn, and N. Gans. 2011. "Estimating the Operational Impact of Container Inspections at International Ports." Management Science 57 (1): 1-20.
Bukowski, C. 1982. "The Beautiful Rush." Typescripts signed January 25 and 26. Images at https://bukowski.net/manuscripts/
Carlton Fields. 2026. "Senate Passes TRIA Reauthorization as House-Senate Differences Await Resolution." October 1. https://www.insurereinsure.com/2026/10/01/senate-passes-tria-reauthorization-as-house-senate-differences-await-resolution/
CBO (Congressional Budget Office). 2016. Scanning and Imaging Shipping Containers Overseas: Costs and Alternatives. Publication 51478. https://www.cbo.gov/publication/51478
CBP (U.S. Customs and Border Protection). n.d. Non-intrusive inspection fact sheet. https://www.cbp.gov/sites/default/files/documents/nii_factsheet_2.pdf
CNBC. 2026. "Container Ship Sinks in Strait of Hormuz as Iran Steps Up Attacks." October 14. https://www.cnbc.com/2026/10/14/container-ship-sinks-strait-hormuz-as-iran-war-attacks.html
Container News. 2025. "Shipping Alliances, Carriers and MSC Control Almost 83% of Market." https://container-news.com/shipping-alliances-carriers-and-msc-control-almost-83-of-market/
Durkheim, É. (1895) 1982. The Rules of Sociological Method. Edited by S. Lukes, translated by W. D. Halls. Macmillan.
Federal News Network. 2026. "House Dems Seek GAO Review of Fractured Counter-WMD Responsibilities." August. https://federalnewsnetwork.com/congress/2026/08/house-dems-seek-gao-review-of-fractured-counter-wmd-responsibilities/
Fox News. 2004. "FBI Official: Sea Cargo Inspections Double to 5 Percent." https://www.foxnews.com/story/fbi-official-sea-cargo-inspections-double-to-5-percent.amp
GAO (U.S. Government Accountability Office). 2004. Homeland Security: Preliminary Observations on Efforts to Target Security Inspections of Cargo Containers. GAO-04-325T.
GAO. 2009. Supply Chain Security: Feasibility and Cost-Benefit Analysis Would Assist DHS and Congress in Assessing and Implementing the Requirement to Scan 100 Percent of U.S.-Bound Containers. GAO-10-12.
GAO. 2012. Supply Chain Security: Container Security Programs Have Matured, but Uncertainty Persists over the Future of 100 Percent Scanning. GAO-12-422T.
GAO. 2016. Maritime Security: Progress and Challenges in Implementing Maritime Cargo Security Programs. GAO-16-790T.
GAO. 2025. Maritime Cargo Security: Additional Efforts Needed to Assess the Effectiveness of DHS's Approach. GAO-25-106953.
gCaptain. 2024. "U.S. Lawmakers Demand Answers from Chinese Crane Manufacturer over Port Security Concerns." https://gcaptain.com/us-lawmakers-demand-answers-from-chinese-crane-manufacturer-over-port-security-concerns
Hall, P. V. 2004. "'We'd Have to Sink the Ships': Impact Studies and the 2002 West Coast Port Lockout." Economic Development Quarterly 18 (4): 354-367.
Homeland Security Defense Forum. 2026. "CBP Is Scanning More Vehicles at the Border." https://www.hsdf.org/the-billion-dollar-question-at-the-border-is-whether-the-equipment-gets-used/
Hong Kong Marine Department. 2026. Port Statistics. https://www.mardep.gov.hk/filemanager/en/share/fact/pdf/portstat_1_b2.pdf
Insurance Journal. 2026. Report on Senate passage of TRIA reauthorization, September 29. https://www.insurancejournal.com/news/national/2026/09/29/887155.htm
Israel MFA (Ministry of Foreign Affairs). 2004. "Palestinian Security Officer Arrested." June 22.
Lloyd's List. 2025. One Hundred Ports 2025, as summarized by PortNews. https://en.portnews.ru/news/381216
MARAD (U.S. Maritime Administration). 2004. Top 30 U.S. Ports, Calendar Year 2003; U.S.-Flag Fleet History.
MARAD. 2025. U.S.-Flag Privately-Owned Merchant Fleet. https://www.maritime.dot.gov/sites/marad.dot.gov/files/2025-11/DS_USFlag-Fleet_2025_MAY.pdf
Martonosi, S. E., D. S. Ortiz, and H. H. Willis. 2005. "Evaluating the Viability of 100 Per Cent Container Inspection at America's Ports." In The Economic Impacts of Terrorist Attacks, edited by H. W. Richardson, P. Gordon, and J. E. Moore. Edward Elgar.
Meade, C., and R. C. Molander. 2006. Considering the Effects of a Catastrophic Terrorist Attack. RAND TR-391.
NBC News. 2009. Report on UAE seizure of North Korean arms. https://www.nbcnews.com/id/wbna32601671
Özcebe, A. G., F. Bozzoni, and B. Borzi. 2022. "Seismic Vulnerability Assessment of Critical Port Infrastructure Components by Modelling the Soil-Wharf-Crane Interaction." Infrastructures 7 (8): 102.
Port of Los Angeles. 2025. Adopted Annual Budget FY 2025/26.
Port of Los Angeles. 2026. Container Statistics. https://portoflosangeles.org/business/statistics/container-statistics
Porter, K., et al. 2013. "The SAFRR Tsunami Scenario." In Ports 2013. ASCE.
Rose, A., I. Sue Wing, D. Wei, and A. Wein. 2016. "Economic Impacts of a California Tsunami." Natural Hazards Review 17 (2).
Rose, A., and D. Wei. 2013. "Estimating the Economic Consequences of a Port Shutdown." Economic Systems Research 25 (2): 212-232.
Rose, A., D. Wei, and A. Wein. 2011. "Economic Impacts of the ShakeOut Scenario." Earthquake Spectra 27 (2).
Rosoff, H., and D. von Winterfeldt. 2007. "A Risk and Economic Analysis of Dirty Bomb Attacks on the Ports of Los Angeles and Long Beach." Risk Analysis 27 (3): 533-546.
Seatrade Maritime. 2024. "Baltimore Channel Fully Reopened." https://www.seatrade-maritime.com/accidents/baltimore-channel-fully-reopened
Seatrade Maritime. 2026. "Jebel Ali Volumes Plummet 90.1% in Second Quarter." https://www.seatrade-maritime.com/ports-logistics/jebel-ali-volumes-plummet-90-1-in-second-quarter
Supply Chain 24/7. 2026. "Top 30 U.S. Ports Import Volume 2025." https://www.supplychain247.com/article/top-30-us-ports-import-volume-2025
straits.live. 2026. Strait of Hormuz daily status, October 30. https://straits.live/
SupplyChainBrain. 2026. "Port of Long Beach Sees Record Year for Cargo Volumes in 2025." https://www.supplychainbrain.com/articles/43235-port-of-long-beach-sees-record-year-for-cargo-volumes-in-2025
The Register. 2017. "NotPetya Ransomware Attack Cost Us $300m, Says Shipping Giant Maersk." August 16.
UNCTAD (UN Trade and Development). 2025. Review of Maritime Transport 2025, as summarized by IIMS. https://www.iims.org.uk/unctad-review-of-maritime-transport-2025-report/
UNCTAD. 2026. Rapid assessment of the Strait of Hormuz disruption, as reported by Seatrade Maritime. https://www.seatrade-maritime.com/security/global-trade-and-growth-to-slow-due-to-hormuz-closure-warns-unctad
USCG (U.S. Coast Guard). 2025. "Cybersecurity in the Marine Transportation System." 90 Fed. Reg. 6298.
U.S. Code. Title 6, § 982.
U.S. Congress. 2026. Homeland Security and Further Additional Continuing Appropriations Act, 2026. Pub. L. 119-86. https://www.govinfo.gov/app/details/PLAW-119publ86
U.S. House. 2026. Joint explanatory statement, Division C, Department of Homeland Security Appropriations Act, 2026. January 19. https://docs.house.gov/billsthisweek/20260119/
Windward. 2026. Strait of Hormuz maritime intelligence, October 29. https://insights.windward.ai/
Wein, A., et al. 2013. "Economic Impacts of the SAFRR Tsunami Scenario in California." USGS Open-File Report 2013-1170, chapter H. https://pubs.usgs.gov/of/2013/1170/h/
World Bank. 2020. Beirut Rapid Damage and Needs Assessment. https://www.worldbank.org/en/country/lebanon/publication/beirut-rapid-damage-and-needs-assessment-rdna---august-2020