The excess death toll of the COVID-19 pandemic in the United States exceeded 1 million, as a low-end estimate of fatalities, in January 2022.

This estimate is based on an extrapolation of California public health fatality data from the pandemic years compared with fatality data from the three years prior to the pandemic. The difference between these two sets of time periods was the estimated excess deaths for the pandemic in California. The California estimate was inflated by the reciprocal of California’s population to the national population. The estimates were done in this manner because fatality estimates during the pandemic are probably less reliable for political reasons. As such, this point estimate may be deemed a low-end estimate since it is assumed that California mitigations were better than average when compared with other states.
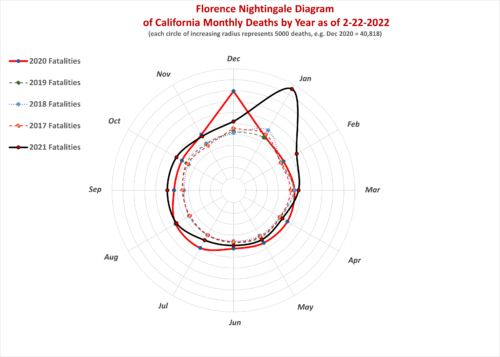
When time-series data is plotted as a normal x-y plot with the time variable along the x-axis it is difficult to identify seasonality or other factors that may influence the data. Florence Nightingale used a form of radial polar plots to display data from the Crimean War that demonstrated the death rate among soldiers could be reduced by better hygiene practices. Plotting the monthly numbers of deaths using this radial form demonstrates the variability during the year.
Based on the date underlying this graphic, it is likely that approximately 1,004,000 Americans, at a minimum, prematurely have died so far in 2020, 2021, and 2022, primarily due to the effects of COVID-19. This rough estimate is an extrapolation derived from California Department of Health and Human Services’ 2021-2022 Provisional Deaths by Month Statewide as of 2-22-2022. The state’s aggregate provisional deaths by month for 2021 and 2022 as well as the state’s total deaths by year for the three prior years were overlaid on a polar coordinate grid by month to approximate a Nightingale rose chart. The approximate area between the solid red outlined ‘drop’ and solid black outlined ‘gourd’ and the ‘rough circles’ translates into about 111,000 excess deaths in California for 2020, 2021 & 2022 combined to date during the pandemic period. Based on California’s proportion of the national population, this returns 1,004,000 as a rough low-ball estimate for total U.S. ‘excess deaths’ for 2020, 2021 & 2022 combined to date. (See https://www.cdc.gov/nchs/nvss/vsrr/covid19/excess_deaths.htm for a discussion of this concept. The estimate is framed as low-end because California mitigations are assumed to be superior to U.S. average mitigations.)
The dark solid line in the upper right quadrant of the ‘target’ shows the steep decline in overall deaths in California from January to June 2021 (which was probably due to the introduction of COVID-19 vaccinations) and an uptick from July to September 2021 probably due to the Delta variant and complacency. The Omicron variant began in November 2021, and deaths once again increased. Subvariant BA.2 promises the same negative outcome.